
1 photo
1444
Frozen Cauliflower
Base: 100g
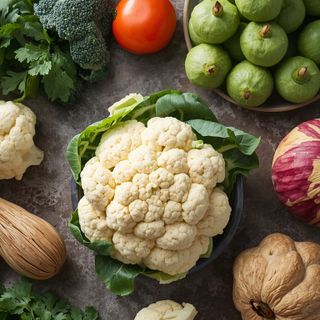
Cauliflower
Kohlrabi
Specification & Key Parameters
8 parameter
| Parameter | Value | Parameter | Value |
|---|---|---|---|
|
Calories / 100g
|
20 kcal (84 kJ) |
Protein / 100g
|
2,2 g |
|
Fat / 100g
|
0,2 g |
Carbs / 100g
|
4,5 g |
|
Fiber / 100g
|
0,0 g |
Indeks glikemiczny (IG)
|
IG 15 |
|
Cena / 100g (Lidl)
|
$0.17 |
Woda / 100g
|
91,5 g |
ECONOMIC ANALYSIS & PRICE COMPARATOR
Store Price Comparator & Portion Cost Calculator — Frozen Cauliflower
Comparison of current market prices per 100 g, 250 g, 500 g, and 1 kg including protein and energy cost efficiency.
Best Price
Auchan
0,16 USD
/ 100 g
Calculate cost for selected weight:
Selected weight cost (100 g)
0,16 USD
Cost per 100 kcal
0,56 USD
Cost per 20 g protein
1,45 USD
| Store / Retailer | Price / 100 g | 250 g Portion | 500 g Pack | Price / 1 kg | Status / Diff |
|---|---|---|---|---|---|
|
Auchan
1 pc / portion: 1,40 USD
|
0,16 USD | 0,40 USD | 0,80 USD | 1,60 USD | Lowest Price |
|
Aldi
1 pc / portion: 1,45 USD
|
0,16 USD | 0,40 USD | 0,80 USD | 1,60 USD | |
|
Kaufland
1 pc / portion: 1,45 USD
|
0,16 USD | 0,40 USD | 0,80 USD | 1,60 USD | |
|
Dino
1 pc / portion: 1,45 USD
|
0,16 USD | 0,40 USD | 0,80 USD | 1,60 USD | |
|
Netto
1 pc / portion: 1,42 USD
|
0,16 USD | 0,40 USD | 0,80 USD | 1,60 USD | |
|
Biedronka
1 pc / portion: 1,45 USD
|
0,16 USD | 0,40 USD | 0,80 USD | 1,60 USD | |
|
Lidl
1 pc / portion: 1,47 USD
|
0,17 USD | 0,43 USD | 0,85 USD | 1,70 USD | +6% |
|
Rewe
1 pc / portion: 1,47 USD
|
0,17 USD | 0,43 USD | 0,85 USD | 1,70 USD | +6% |
|
Edeka
1 pc / portion: 1,47 USD
|
0,17 USD | 0,43 USD | 0,85 USD | 1,70 USD | +6% |
|
Walmart
1 pc / portion: 1,49 USD
|
0,17 USD | 0,43 USD | 0,85 USD | 1,70 USD | +6% |
|
Target
1 pc / portion: 1,47 USD
|
0,17 USD | 0,43 USD | 0,85 USD | 1,70 USD | +6% |
|
Carrefour
1 pc / portion: 1,52 USD
|
0,17 USD | 0,43 USD | 0,85 USD | 1,70 USD | +6% |
|
Trader Joe's
1 pc / portion: 1,47 USD
|
0,17 USD | 0,43 USD | 0,85 USD | 1,70 USD | +6% |
|
Żabka
1 pc / portion: 1,74 USD
|
0,20 USD | 0,50 USD | 1,00 USD | 2,00 USD | +25% |
Smart Voice
•Listen to the article content live
0:00
/
0:00
Nutritional Profile & Bioactivity
Nutrients
Precise micro- and macronutrient analysis with daily reference intake (RDA) coverage (100g)
Macronutrient Distribution
100g
29
kcal
Protein
2.2g
Fat
0.2g
Carbs
4.5g

Bio-Analysis
Food Product
Frozen Cauliflower
29 kcal
B: 2.2g
T: 0.2g
W: 4.5g
🔍
Looking for a specific mineral or vitamin?
Explore all 90 nutrients organized by category and RDA coverage.
Contains allergens
1
Nutrient
Alpha Linolenic Acid
0.04
g
Nutrient
Arginine
0.1
g
Nutrient
Ash
0.8
g
Nutrient
Beta-Cryptoxanthin
1
µg
Nutrient
Beta-carotene
10
µg
Nutrient
Beta-sitosterol
8
mg
Nutrient
Boron
200
mg
Nutrient
1% RDA
Calcium
11
mg
Nutrient
Calories
25
kcal
Nutrient
Campesterol
1
g
Nutrient
2% RDA
Carbohydrate
4.5
g
Nutrient
Chlorine
37
mg
Nutrient
Cholesterol
1
mg
Nutrient
Chromium
0.5
µg
Nutrient
Citric acid
100
mg
Nutrient
Cobalt
0.1
µg
Nutrient
Copper
0.03
mg
Nutrient
Energy
105
kJ
Nutrient
Fat
0.2
g
Nutrient
Fatty monounsaturated
0.01
g
Nutrient
Fatty polyunsaturated
0.09
g
Nutrient
Fatty saturated
0.03
g
Nutrient
Fatty trans
1
g
Nutrient
9% RDA
Fiber
2.2
g
Nutrient
Fiber insoluble
1.4
g
Nutrient
Fiber soluble
0.8
g
Nutrient
Fluoride
1
mg
Nutrient
Folate
57
µg
Nutrient
Fructose
0.9
g
Nutrient
Galactose
1
g
Nutrient
Glucose
0.9
g
Nutrient
Glutamine
0.2
g
Nutrient
Insoluble fiber
1.4
g
Nutrient
Inulin
0.5
g
Nutrient
1% RDA
Iodine
1
µg
Nutrient
4% RDA
Iron
0.5
mg
Nutrient
Lactose
1
g
Nutrient
Linoleic Acid
0.08
g
Nutrient
Lutein + zeaxanthin
1
mg
Nutrient
Lycopene
1
µg
Nutrient
Lysine
0.1
g
Nutrient
2% RDA
Magnesium
9
mg
Nutrient
Malic acid
50
g
Nutrient
Manganese
0.19
mg
Nutrient
Molybdenum
10
µg
Nutrient
Nickel
5
mg
Nutrient
Oleic Acid
0.01
g
Nutrient
Omega 3
0.04
g
Nutrient
Omega 6
0.08
g
Nutrient
Oxalic acid
1
mg
Nutrient
3% RDA
Phosphorus
23
mg
Nutrient
Phytosterols
10
mg
Nutrient
9% RDA
Potassium
173
mg
Nutrient
4% RDA
Protein
2.2
g
Nutrient
Protein Animal
1
g
Nutrient
Protein Plant
2.2
g
Nutrient
Quinic acid
10
g
Nutrient
Raffinose
0.2
g
Nutrient
Salt
0.05
g
Nutrient
1% RDA
Selenium
0.6
µg
Nutrient
Silica
1
mg
Nutrient
Simple Sugars
1.9
g
Nutrient
1% RDA
Sodium
21
mg
Nutrient
Soluble fiber
0.8
g
Nutrient
Stachyose
0.1
g
Nutrient
Starch
1.5
g
Nutrient
Stigmasterol
1
g
Nutrient
Sucrose
0.2
g
Nutrient
4% RDA
Sugar
1.9
g
Nutrient
Sugar Alcohols
1
g
Nutrient
Sugar added
1
g
Nutrient
Sulfur
30
mg
Nutrient
Total Carbohydrates
4.5
g
Nutrient
Total Fat
0.2
g
Nutrient
Total sugar alcohols
1
g
Nutrient
Verbascose
1
g
Nutrient
Vitamin A
2
µg
Nutrient
Vitamin B1 (Thiamin)
0.09
mg
Nutrient
Vitamin B12 (Cobalamin)
1
µg
Nutrient
Vitamin B2 (Riboflavin)
0.08
mg
Nutrient
Vitamin B3 (Niacin)
0.49
mg
Nutrient
Vitamin B4 (Choline)
44.3
mg
Nutrient
Vitamin B5 (Pantothenic acid)
0.66
mg
Nutrient
Vitamin B6 (Pyridoxine)
0.12
mg
Nutrient
Vitamin C (Ascorbic acid)
43.5
mg
Nutrient
7% RDA
Vitamin D
1
µg
Nutrient
1% RDA
Vitamin E
0.11
mg
Nutrient
21% RDA
Vitamin K
15.5
µg
Nutrient
Water
91.5
g
Nutrient
2% RDA
Zinc
0.19
mg
| Name | Category | Amount | % RDA |
|---|---|---|---|
| Alpha Linolenic Acid | - | 0.04 g | - |
| Arginine | - | 0.1 g | - |
| Ash | - | 0.8 g | - |
| Beta-Cryptoxanthin | - | 1 µg | - |
| Beta-carotene | - | 10 µg | - |
| Beta-sitosterol | - | 8 mg | - |
| Boron | - | 200 mg | - |
| Calcium | - | 11 mg | 1% |
| Calories | - | 25 kcal | - |
| Campesterol | - | 1 g | - |
| Carbohydrate | - | 4.5 g | 2% |
| Chlorine | - | 37 mg | - |
| Cholesterol | - | 1 mg | - |
| Chromium | - | 0.5 µg | - |
| Citric acid | - | 100 mg | - |
| Cobalt | - | 0.1 µg | - |
| Copper | - | 0.03 mg | - |
| Energy | - | 105 kJ | - |
| Fat | - | 0.2 g | - |
| Fatty monounsaturated | - | 0.01 g | - |
| Fatty polyunsaturated | - | 0.09 g | - |
| Fatty saturated | - | 0.03 g | - |
| Fatty trans | - | 1 g | - |
| Fiber | - | 2.2 g | 9% |
| Fiber insoluble | - | 1.4 g | - |
| Fiber soluble | - | 0.8 g | - |
| Fluoride | - | 1 mg | - |
| Folate | - | 57 µg | - |
| Fructose | - | 0.9 g | - |
| Galactose | - | 1 g | - |
| Glucose | - | 0.9 g | - |
| Glutamine | - | 0.2 g | - |
| Insoluble fiber | - | 1.4 g | - |
| Inulin | - | 0.5 g | - |
| Iodine | - | 1 µg | 1% |
| Iron | - | 0.5 mg | 4% |
| Lactose | - | 1 g | - |
| Linoleic Acid | - | 0.08 g | - |
| Lutein + zeaxanthin | - | 1 mg | - |
| Lycopene | - | 1 µg | - |
| Lysine | - | 0.1 g | - |
| Magnesium | - | 9 mg | 2% |
| Malic acid | - | 50 g | - |
| Manganese | - | 0.19 mg | - |
| Molybdenum | - | 10 µg | - |
| Nickel | - | 5 mg | - |
| Oleic Acid | - | 0.01 g | - |
| Omega 3 | - | 0.04 g | - |
| Omega 6 | - | 0.08 g | - |
| Oxalic acid | - | 1 mg | - |
| Phosphorus | - | 23 mg | 3% |
| Phytosterols | - | 10 mg | - |
| Potassium | - | 173 mg | 9% |
| Protein | - | 2.2 g | 4% |
| Protein Animal | - | 1 g | - |
| Protein Plant | - | 2.2 g | - |
| Quinic acid | - | 10 g | - |
| Raffinose | - | 0.2 g | - |
| Salt | - | 0.05 g | - |
| Selenium | - | 0.6 µg | 1% |
| Silica | - | 1 mg | - |
| Simple Sugars | - | 1.9 g | - |
| Sodium | - | 21 mg | 1% |
| Soluble fiber | - | 0.8 g | - |
| Stachyose | - | 0.1 g | - |
| Starch | - | 1.5 g | - |
| Stigmasterol | - | 1 g | - |
| Sucrose | - | 0.2 g | - |
| Sugar | - | 1.9 g | 4% |
| Sugar Alcohols | - | 1 g | - |
| Sugar added | - | 1 g | - |
| Sulfur | - | 30 mg | - |
| Total Carbohydrates | - | 4.5 g | - |
| Total Fat | - | 0.2 g | - |
| Total sugar alcohols | - | 1 g | - |
| Verbascose | - | 1 g | - |
| Vitamin A | - | 2 µg | - |
| Vitamin B1 (Thiamin) | - | 0.09 mg | - |
| Vitamin B12 (Cobalamin) | - | 1 µg | - |
| Vitamin B2 (Riboflavin) | - | 0.08 mg | - |
| Vitamin B3 (Niacin) | - | 0.49 mg | - |
| Vitamin B4 (Choline) | - | 44.3 mg | - |
| Vitamin B5 (Pantothenic acid) | - | 0.66 mg | - |
| Vitamin B6 (Pyridoxine) | - | 0.12 mg | - |
| Vitamin C (Ascorbic acid) | - | 43.5 mg | - |
| Vitamin D | - | 1 µg | 7% |
| Vitamin E | - | 0.11 mg | 1% |
| Vitamin K | - | 15.5 µg | 21% |
| Water | - | 91.5 g | - |
| Zinc | - | 0.19 mg | 2% |
No nutrients matching your search criteria
Nutritional Profile Comparison
📈 Interactive ChartNutrient content comparison per serving
BioNutrition OS Engine
Low (GL < 10)
Blood Glucose Curve & Glycemic Index
Projected postprandial glucose and insulin response
Blood Glucose Curve (0-180 min)
55 min
•
Glucose: ~91.4 mg/dL
•
Insulin: 12.5 µIU/mL
Glycemic Load
GL
0.7
/ serving
Net carbohydrates:
4.5g
Glycemic Index
IG
15
/ 100
Peak glucose concentration
~91.4 mg/dL
Estimated peak time:
55 min
Fat and fiber buffer
-3% of peak
Slowing dietary fiber:
0g
Clinical insights:
Balanced glycemic profile with a gentle glucose curve. Provides optimal balance between energy availability and metabolic stability.