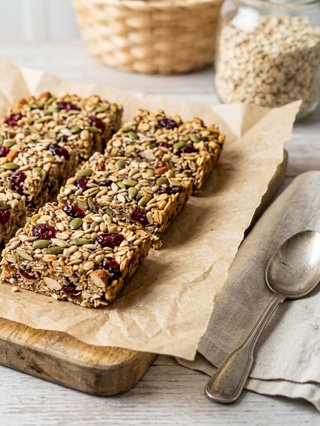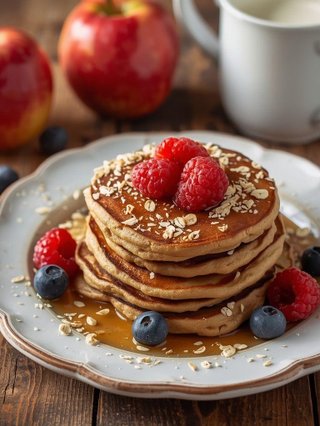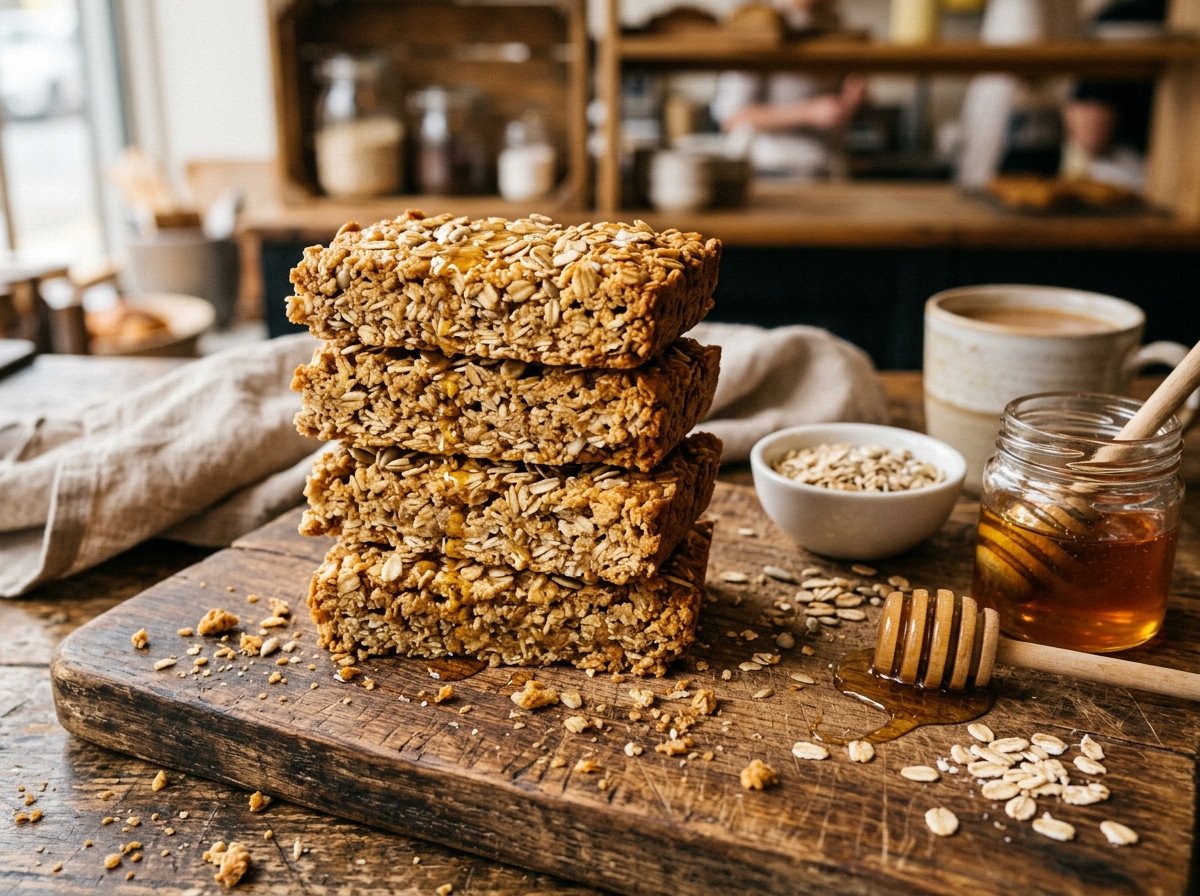
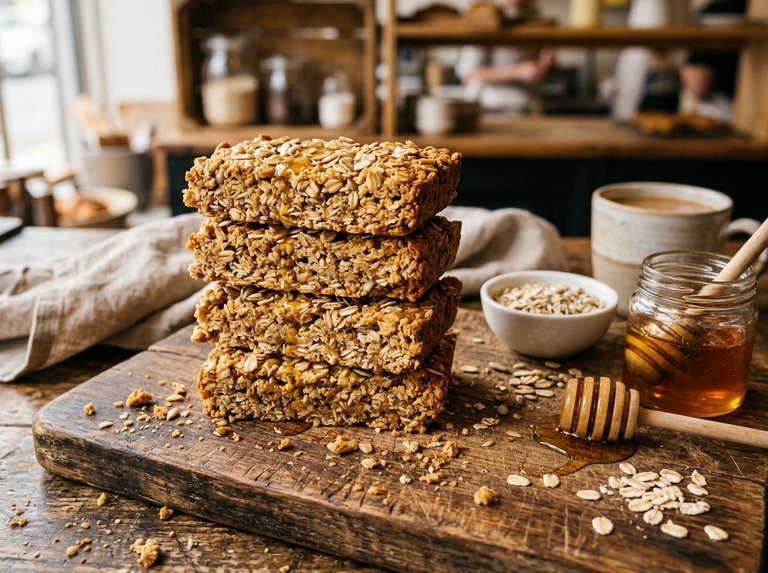
Baked Honey Oat Breakfast Bars
| Parameter | Value | Parameter | Value |
|---|---|---|---|
|
Preparation time
|
35 min |
Number of portions
|
12 |
|
Cena (Walmart)
|
$2.83 |
Cost of one portion
|
$0.24 |
|
Number of ingredients needed for preparation
|
7 |
Total calories
|
3094 |
|
Calories per 1 portion
|
258 kcal |
Amount of protein per portion
|
7g |
|
Amount of fat per portion
|
10g |
Amount of carbohydrates per portion
|
35g |
|
Amount of fiber per portion
|
4g |
Glycemic Index (GI)
|
IG 45 |
|
Glycemic Load (GL)
|
GL 13.7 |
Ingredients




Supermarket Chain Price Comparator — Baked Honey Oat Breakfast Bars
Compare estimated shopping costs across major supermarket chains, scale portions or weight, and calculate the route to your nearest store.
| Select supermarket chain | 1 portion | 1 portion | 2 portions | 4 portions | Find store on map & calculate route |
|---|---|---|---|---|---|
Aldi
Cheapest
|
0,22 € | 0,22 € | 0,44 € | 0,88 € | |
Lidl
|
0,22 € | 0,22 € | 0,44 € | 0,88 € | |
Tesco
+9%
|
0,24 € | 0,24 € | 0,48 € | 0,96 € | |
Carrefour
+14%
|
0,25 € | 0,25 € | 0,50 € | 1,00 € | |
SPAR
+14%
|
0,25 € | 0,25 € | 0,50 € | 1,00 € |
Recipe Summary & Culinary Insights
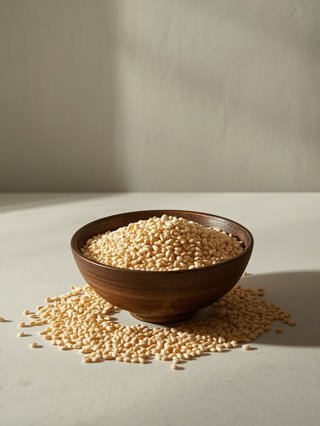
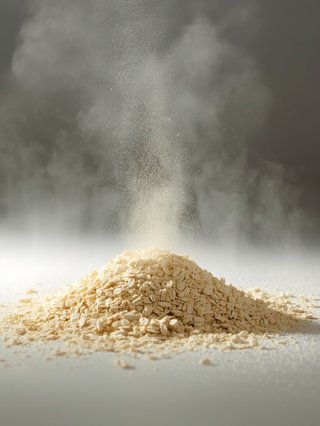
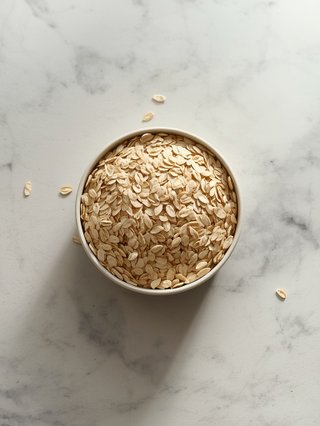
Baked Honey Oat Breakfast Bars is an appetizing, thoughtfully crafted culinary creation that pairs vibrant natural flavor with high nutrient density. Built around rolled oats, whole wheat flour, butter, honey, eggs, ground cinnamon, the dish delivers an inviting aroma, satisfying texture contrast, and clean culinary character.
Its balanced nutritional profile supports a smooth postprandial glycemic response, lasting satiety, and comfortable digestion. The synergy of quality proteins, dietary fiber, healthy fats, and natural antioxidants supports metabolic health and daily cellular recovery.
Recipe preparation steps
Nutrients
Precise micro- and macronutrient analysis with daily reference intake (RDA) coverage (1 portion)
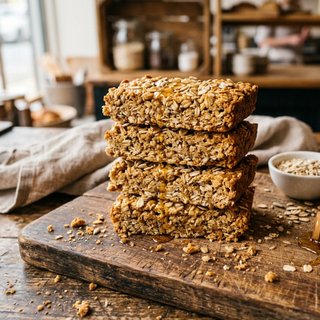
Baked Honey Oat Breakfast Bars
Ash
Beta-Cryptoxanthin
Calcium
Carbohydrate
Chlorine
Cholesterol
Copper
Fat
Fatty monounsaturated
Fatty polyunsaturated
Fatty saturated
Fatty trans
Fiber
Fructose
Glucose
Iron
Lutein + zeaxanthin
Lycopene
Magnesium
Manganese
Omega 3
Omega 6
Phosphorus
Potassium
Protein
Retinol
Salt
Selenium
Sodium
Sucrose
Sugar
Vitamin A
Vitamin B1 (Thiamin)
Vitamin B12 (Cobalamin)
Vitamin B2 (Riboflavin)
Vitamin B3 (Niacin)
Vitamin B4 (Choline)
Vitamin B6 (Pyridoxine)
Vitamin B9 (Folate)
Vitamin C (Ascorbic acid)
Vitamin D
Vitamin D3
Vitamin E
Vitamin K
Water
Zinc
| Name | Category | Amount | % RDA |
|---|---|---|---|
| Ash | - | 0.4 g | - |
| Beta-Cryptoxanthin | - | 1.83 µg | - |
| Calcium | - | 21.47 mg | 3% |
| Carbohydrate | - | 35 g | 14% |
| Chlorine | - | 17.18 mg | - |
| Cholesterol | - | 33.1 mg | - |
| Copper | - | 0.02 mg | - |
| Fat | - | 10.11 g | 14% |
| Fatty monounsaturated | - | 0.4 g | - |
| Fatty polyunsaturated | - | 0.07 g | - |
| Fatty saturated | - | 0.38 g | - |
| Fatty trans | - | 0.01 g | - |
| Fiber | - | 4.49 g | 18% |
| Fructose | - | 4.09 g | - |
| Glucose | - | 3.54 g | - |
| Iron | - | 0.3 mg | 2% |
| Lutein + zeaxanthin | - | 34.83 mg | - |
| Lycopene | - | 0.09 µg | - |
| Magnesium | - | 1.6 mg | - |
| Manganese | - | 0.01 mg | - |
| Omega 3 | - | 0 g | - |
| Omega 6 | - | 0.06 g | - |
| Phosphorus | - | 30.3 mg | 4% |
| Potassium | - | 16.79 mg | 1% |
| Protein | - | 6.71 g | 13% |
| Retinol | - | 24.93 µg | - |
| Salt | - | 88.37 g | - |
| Selenium | - | 2.81 µg | 5% |
| Sodium | - | 48.63 mg | 2% |
| Sucrose | - | 0.13 g | - |
| Sugar | - | 7.91 g | 16% |
| Vitamin A | - | 24.93 µg | 3% |
| Vitamin B1 (Thiamin) | - | 0.01 mg | - |
| Vitamin B12 (Cobalamin) | - | 0.15 µg | - |
| Vitamin B2 (Riboflavin) | - | 0.06 mg | - |
| Vitamin B3 (Niacin) | - | 0.03 mg | - |
| Vitamin B4 (Choline) | - | 26.95 mg | - |
| Vitamin B6 (Pyridoxine) | - | 0.01 mg | - |
| Vitamin B9 (Folate) | - | 4.51 µg | - |
| Vitamin C (Ascorbic acid) | - | 0.14 mg | - |
| Vitamin D | - | 0.16 µg | 1% |
| Vitamin D3 | - | 0.16 µg | - |
| Vitamin E | - | 0.07 mg | 1% |
| Vitamin K | - | 0.05 µg | - |
| Water | - | 8.67 g | - |
| Zinc | - | 0.18 mg | 2% |
No nutrients matching your search criteria
Nutritional Profile Comparison
📈 Interactive ChartNutrient content comparison per serving
Blood Glucose Curve & Glycemic Index
Biochemical model of blood glucose dynamics (0-180 min) accounting for fat, protein, and fiber buffering.
Blood Glucose Curve (0-180 min)
Biochemical model of blood glucose dynamics (0-180 min) accounting for fat, protein, and fiber buffering.
Glycemic Load (GL) combines both the Glycemic Index (GI) and the actual amount of digestible carbohydrates in a serving.
Clinical thresholds: Low ≤ 10 pts • Moderate 11–19 pts • High ≥ 20 pts