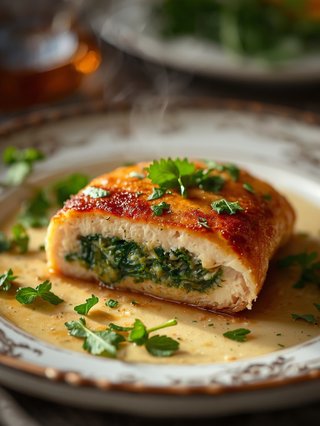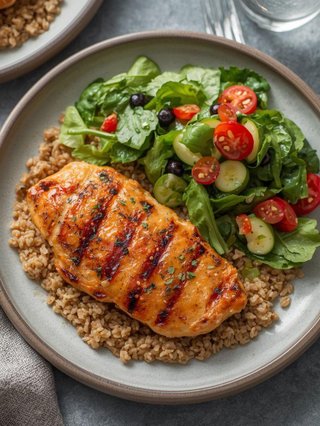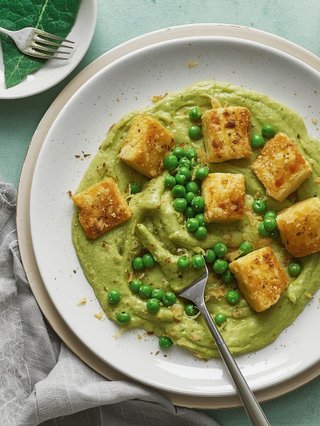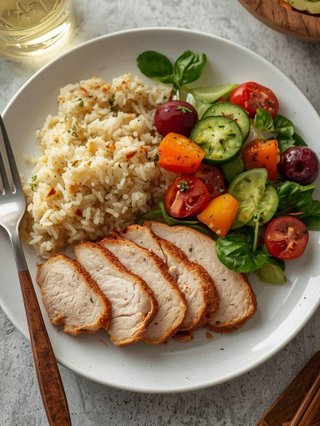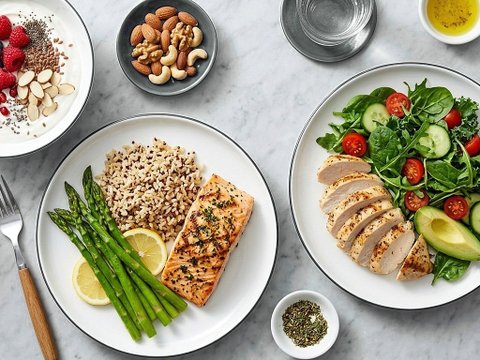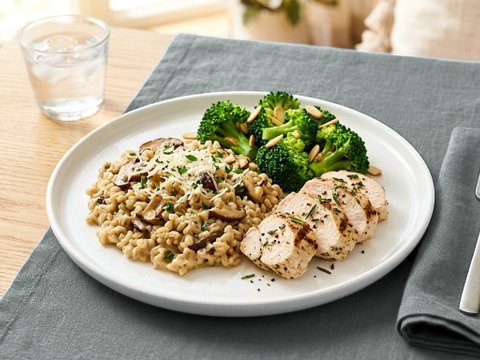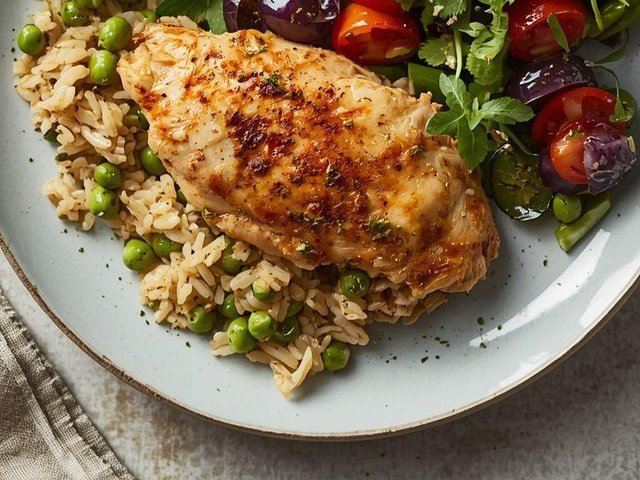
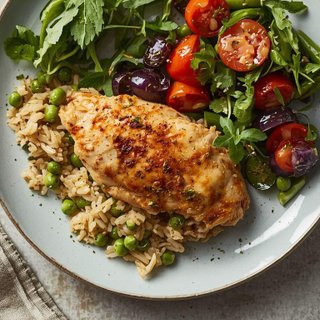
Stuffed chicken breast with peas, rice, and salad

| Parameter | Value | Parameter | Value |
|---|---|---|---|
|
Preparation time
|
32 min |
Number of portions
|
1 |
|
Cena (Walmart)
|
$1.58 |
Cost of one portion
|
$1.58 |
|
Number of ingredients needed for preparation
|
8 |
Total calories
|
614 kcal |
|
Glycemic Index (GI)
|
IG 50 |
Glycemic Load (GL)
|
GL 39.0 |
Ingredients
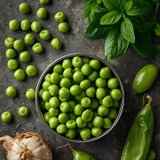
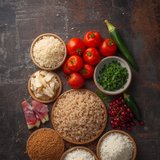
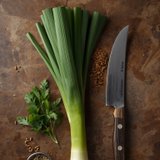

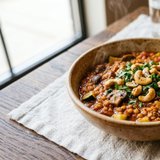
Show Supermarket Price Comparison & Trend
Compare grocery chains & historical meal cost
Supermarket Chain Price Comparator — Stuffed chicken breast with peas, rice, and salad
Compare estimated shopping costs across major supermarket chains, scale portions or weight, and calculate the route to your nearest store.
| Select supermarket chain | 1 portion | 1 portion | 2 portions | 4 portions | Find store on map & calculate route |
|---|---|---|---|---|---|
Aldi
Cheapest
|
1,44 € | 1,44 € | 2,88 € | 5,76 € | |
Lidl
+1%
|
1,45 € | 1,45 € | 2,90 € | 5,80 € | |
Tesco
+10%
|
1,58 € | 1,58 € | 3,16 € | 6,32 € | |
Carrefour
+13%
|
1,63 € | 1,63 € | 3,26 € | 6,52 € | |
SPAR
+16%
|
1,67 € | 1,67 € | 3,34 € | 6,68 € |
Recipe Summary & Culinary Insights
This dish features a harmonious blend of tender poultry and a vibrant filling made of green peas and fresh parsley. The gentle steaming method preserves the succulence of the meat, while the addition of Herbes de Provence provides a fragrant, Mediterranean touch. The meal is complemented by wholesome brown rice and a crisp salad of leeks, bell peppers, and tomatoes, creating a delightful contrast in textures.
The combination of high-quality protein and complex carbohydrates promotes lasting satiety and supports a balanced metabolism. The fiber provided by the vegetables and whole grains aids healthy digestion and ensures a steady release of energy throughout the day. By avoiding heavy sauces, the dish remains light and easy for the body to process.
The preparation is straightforward and fits perfectly into a health-conscious lifestyle. Being naturally free from gluten and dairy, this recipe is an excellent choice for those with specific dietary requirements. It serves as a complete, nutritious meal that satisfies the palate while naturally supporting daily wellness goals.
Recipe preparation steps
Show Full Micronutrient Profile, Allergens & Glucose Curve
Vitamins, minerals, amino acids & glycemic load simulation
Nutrients
Precise micro- and macronutrient analysis with daily reference intake (RDA) coverage (1 portion)
Stuffed chicken breast with peas, rice, and salad
Acidity
Added sugar
Alanine
Alcohol
Alpha-linolenic acid
Animal protein
Argentina
Ash
Aspartic acid
Beta-Carotene
Beta-cryptoxanthin
Beta-sitosterol
Bor
Calcium
Campesterol
Carbohydrates
Carbohydrates, total
Carotene Alpha
Carotene Beta
Cheese
Chlor
Chlor
Cholesterol
Chromium
Citric acid
Cobalt
Copper
Cranberry juice
Cysteine
Fat
Fat, total
Fiber
Fitosterol
Fluor
Folic acid
Fructose
Galaxy
Glucose
Glutamine
Glutamine
Glycine
Histidine
Hydroxyproline
Insoluble fiber
Inulin
Iodine
Iron
Isoleucine
Lactose
Leucine
Linoleic acid
Lutein + zeaxanthin
Lymphopenia
Lysine
Magnesium
Maltose
Manganese
Methionine
Molybdenum
Monounsaturated fatty acids
Nickel
Nitrogen
Oleic acid
Omega 3
Omega 6
Oxalic acid
Palmitic Acid
Phenylalanine
Phosphorus
Phytoen
Phytofluen
Polyols
Polyunsaturated fatty acids
Potassium
Proline
Protein
Salt
Saturated fatty acids
Selenium
Sodium
Soluble fiber
Sponge cake
Starch
Stearic Acid
Stigmasterol
Sucrose
Sugar
Sugar alcohols
Sulfur
Taurine
Threonine
Trans fatty acids
Tryptophan
Tyrosine
Valina
Vitamin A
Vitamin B1 (Thiamine)
Vitamin B12 (Cobalamin)
Vitamin B2 (Riboflavin)
Vitamin B3 (Niacin)
Vitamin B4 (Choline)
Vitamin B5 (Pantothenic acid)
Vitamin B6 (Pyridoxine)
Vitamin B7 (Biotin)
Vitamin B8 (Inositol)
Vitamin B9 (Folic acid)
Vitamin C (Ascorbic acid)
Vitamin D
Vitamin E
Vitamin K
Water
Zinc
| Name | Category | Amount | % RDA |
|---|---|---|---|
| Acidity | - | 0.48 g | - |
| Added sugar | - | 1.2 g | - |
| Alanine | - | 36 g | - |
| Alcohol | - | 1.2 g | - |
| Alpha-linolenic acid | - | 0.04 g | - |
| Animal protein | - | 21 g | - |
| Argentina | - | 42 g | - |
| Ash | - | 4.58 g | - |
| Aspartic acid | - | 108 g | - |
| Beta-Carotene | - | 1271.99 µg | - |
| Beta-cryptoxanthin | - | 12 µg | - |
| Beta-sitosterol | - | 14.35 mg | - |
| Bor | - | 0.12 mg | - |
| Calcium | - | 109.83 mg | 14% |
| Campesterol | - | 0.6 g | - |
| Carbohydrates | - | 96.77 g | 37% |
| Carbohydrates, total | - | 4.32 g | - |
| Carotene Alpha | - | 121.2 µg | - |
| Carotene Beta | - | 538.8 mg | - |
| Cheese | - | 36 g | - |
| Chlor | - | 52.8 mg | - |
| Chlor | - | 63.75 mg | - |
| Cholesterol | - | 63.36 mg | - |
| Chromium | - | 3 µg | - |
| Citric acid | - | 0.48 mg | - |
| Cobalt | - | 1.2 µg | - |
| Copper | - | 0.55 mg | - |
| Cranberry juice | - | 0.12 g | - |
| Cysteine | - | 6 g | - |
| Fat | - | 9.5 g | 14% |
| Fat, total | - | 0.24 g | - |
| Fiber | - | 18.76 g | 75% |
| Fitosterol | - | 37.4 mg | - |
| Fluor | - | 1.2 mg | - |
| Folic acid | - | 80.72 µg | - |
| Fructose | - | 3.34 g | - |
| Galaxy | - | 1.2 g | - |
| Glucose | - | 3.49 g | - |
| Glutamine | - | 175.31 g | - |
| Glutamine | - | 72 g | - |
| Glycine | - | 30 g | - |
| Histidine | - | 18 g | - |
| Hydroxyproline | - | 1.2 g | - |
| Insoluble fiber | - | 13.34 g | - |
| Inulin | - | 0.09 g | - |
| Iodine | - | 1.2 µg | 1% |
| Iron | - | 5 mg | 36% |
| Isoleucine | - | 30.27 g | - |
| Lactose | - | 1.2 g | - |
| Leucine | - | 48.63 g | - |
| Linoleic acid | - | 0.49 g | - |
| Lutein + zeaxanthin | - | 1433.11 mg | - |
| Lymphopenia | - | 3087.6 µg | - |
| Lysine | - | 48.27 g | - |
| Magnesium | - | 168.7 mg | 45% |
| Maltose | - | 1.2 g | - |
| Manganese | - | 2.69 mg | - |
| Methionine | - | 12 g | - |
| Molybdenum | - | 10.2 µg | - |
| Monounsaturated fatty acids | - | 4.79 g | - |
| Nickel | - | 1.2 mg | - |
| Nitrogen | - | 16.8 g | - |
| Oleic acid | - | 3.5 g | - |
| Omega 3 | - | 0.16 g | - |
| Omega 6 | - | 1.88 g | - |
| Oxalic acid | - | 6 mg | - |
| Palmitic Acid | - | 0.68 g | - |
| Phenylalanine | - | 36 g | - |
| Phosphorus | - | 555.33 mg | 79% |
| Phytoen | - | 3600 µg | - |
| Phytofluen | - | 360 µg | - |
| Polyols | - | 1.2 g | - |
| Polyunsaturated fatty acids | - | 2.02 g | - |
| Potassium | - | 1217.09 mg | 61% |
| Proline | - | 30 g | - |
| Protein | - | 35.31 g | 71% |
| Salt | - | 0.66 g | - |
| Saturated fatty acids | - | 1.9 g | - |
| Selenium | - | 42.99 µg | 78% |
| Sodium | - | 337.31 mg | 17% |
| Soluble fiber | - | 4.17 g | - |
| Sponge cake | - | 1.2 mg | - |
| Starch | - | 78.66 g | - |
| Stearic Acid | - | 0.12 g | - |
| Stigmasterol | - | 0.36 g | - |
| Sucrose | - | 1.97 g | - |
| Sugar | - | 10.28 g | 21% |
| Sugar alcohols | - | 1.2 g | - |
| Sulfur | - | 14.4 mg | - |
| Taurine | - | 1.2 mg | - |
| Threonine | - | 30 g | - |
| Trans fatty acids | - | 1.26 g | - |
| Tryptophan | - | 12 g | - |
| Tyrosine | - | 24 g | - |
| Valina | - | 42.45 g | - |
| Vitamin A | - | 347.61 µg | 44% |
| Vitamin B1 (Thiamine) | - | 0.97 mg | - |
| Vitamin B12 (Cobalamin) | - | 1.55 µg | - |
| Vitamin B2 (Riboflavin) | - | 0.41 mg | - |
| Vitamin B3 (Niacin) | - | 22.88 mg | - |
| Vitamin B4 (Choline) | - | 22.31 mg | - |
| Vitamin B5 (Pantothenic acid) | - | 3.1 mg | - |
| Vitamin B6 (Pyridoxine) | - | 1.64 mg | - |
| Vitamin B7 (Biotin) | - | 1.29 mg | - |
| Vitamin B8 (Inositol) | - | 24 mg | - |
| Vitamin B9 (Folic acid) | - | 78.77 µg | - |
| Vitamin C (Ascorbic acid) | - | 120.24 mg | - |
| Vitamin D | - | 1.31 µg | 9% |
| Vitamin E | - | 3.83 mg | 32% |
| Vitamin K | - | 164.64 µg | 220% |
| Water | - | 375.57 g | - |
| Zinc | - | 3.7 mg | 37% |
No nutrients matching your search criteria
Nutritional Profile Comparison
📈 Interactive ChartNutrient content comparison per serving
Blood Glucose Curve & Glycemic Index
Biochemical model of blood glucose dynamics (0-180 min) accounting for fat, protein, and fiber buffering.
Blood Glucose Curve (0-180 min)
Biochemical model of blood glucose dynamics (0-180 min) accounting for fat, protein, and fiber buffering.
Glycemic Load (GL) combines both the Glycemic Index (GI) and the actual amount of digestible carbohydrates in a serving.
Clinical thresholds: Low ≤ 10 pts • Moderate 11–19 pts • High ≥ 20 pts