
Pasteurized Milk
| Parameter | Value | Parameter | Value |
|---|---|---|---|
|
Calories / 100g
|
56 kcal (236 kJ) |
Protein / 100g
|
3,1 g |
|
Fat / 100g
|
2,8 g |
Carbs / 100g
|
4,7 g |
|
Fiber / 100g
|
0,0 g |
Glycemic Index (GI)
|
IG 30 |
|
Glycemic Load (GL)
|
GL 2.8 |
Cena / 100g (Walmart)
|
$0.10 |
|
Woda / 100g
|
88,4 g |
Supermarket Chain Price Comparator — Pasteurized Milk
Compare estimated shopping costs across major supermarket chains, scale portions or weight, and calculate the route to your nearest store.
| Select supermarket chain | 100 g | 100 g | 250 g | 500 g | 1 kg | Find store on map & calculate route |
|---|---|---|---|---|---|---|
Auchan
Cheapest
|
0,09 USD | 0,09 USD | 0,22 USD | 0,45 USD | 0,90 USD | |
Netto
|
0,09 USD | 0,09 USD | 0,22 USD | 0,45 USD | 0,90 USD | |
Biedronka
|
0,09 USD | 0,09 USD | 0,22 USD | 0,45 USD | 0,90 USD | |
Aldi
+11%
|
0,10 USD | 0,10 USD | 0,25 USD | 0,50 USD | 1,00 USD | |
Carrefour
+11%
|
0,10 USD | 0,10 USD | 0,25 USD | 0,50 USD | 1,00 USD | |
Lidl
+11%
|
0,10 USD | 0,10 USD | 0,25 USD | 0,50 USD | 1,00 USD | |
Dino
+11%
|
0,10 USD | 0,10 USD | 0,25 USD | 0,50 USD | 1,00 USD | |
Kaufland
+11%
|
0,10 USD | 0,10 USD | 0,25 USD | 0,50 USD | 1,00 USD | |
Rewe
+11%
|
0,10 USD | 0,10 USD | 0,25 USD | 0,50 USD | 1,00 USD | |
Żabka
+22%
|
0,11 USD | 0,11 USD | 0,28 USD | 0,55 USD | 1,10 USD |
Smart Voice
AINutrients
Precise micro- and macronutrient analysis with daily reference intake (RDA) coverage (100 g)

Pasteurized Milk
Ash
Boron
Calcium
Carbohydrate
Carotene Beta
Casein
Chlorine
Cholesterol
Copper
Fat
Fatty monounsaturated
Fatty polyunsaturated
Fatty saturated
Fatty trans
Fiber
Fiber insoluble
Fiber soluble
Fluoride
Glycine
Iodine
Iron
Lactose
Lutein + zeaxanthin
Magnesium
Molybdenum
Natron
Omega 3
Omega 6
Phosphorus
Potassium
Protein
Protein Animal
Retinol
Salt
Selenium
Silica
Sodium
Sugar
Sulfur
Vitamin A
Vitamin ARE
Vitamin B1 (Thiamin)
Vitamin B12 (Cobalamin)
Vitamin B2 (Riboflavin)
Vitamin B3 (Niacin)
Vitamin B4 (Choline)
Vitamin B5 (Pantothenic acid)
Vitamin B6 (Pyridoxine)
Vitamin B7 (Biotin)
Vitamin B9 (Folate)
Vitamin C (Ascorbic acid)
Vitamin D
Vitamin E
Vitamin K
Water
Zinc
| Name | Category | Amount | % RDA |
|---|---|---|---|
| Ash | - | 0.7 g | - |
| Boron | - | 0.03 mg | - |
| Calcium | - | 120 mg | 15% |
| Carbohydrate | - | 4.7 g | 2% |
| Carotene Beta | - | 14 mg | - |
| Casein | - | 2.6 g | - |
| Chlorine | - | 96 mg | - |
| Cholesterol | - | 11 mg | - |
| Copper | - | 0.01 mg | - |
| Fat | - | 2.8 g | 4% |
| Fatty monounsaturated | - | 0.7 g | - |
| Fatty polyunsaturated | - | 0.1 g | - |
| Fatty saturated | - | 1.7 g | - |
| Fatty trans | - | 0.1 g | - |
| Fiber | - | 1 g | 4% |
| Fiber insoluble | - | 1 g | - |
| Fiber soluble | - | 1 g | - |
| Fluoride | - | 0.02 mg | - |
| Glycine | - | 20 g | - |
| Iodine | - | 9.2 µg | 6% |
| Iron | - | 0.03 mg | - |
| Lactose | - | 4.7 g | - |
| Lutein + zeaxanthin | - | 15 mg | - |
| Magnesium | - | 10 mg | 3% |
| Molybdenum | - | 0.01 µg | - |
| Natron | - | 39 g | - |
| Omega 3 | - | 0.03 g | - |
| Omega 6 | - | 0.09 g | - |
| Phosphorus | - | 90 mg | 13% |
| Potassium | - | 150 mg | 8% |
| Protein | - | 3.1 g | 6% |
| Protein Animal | - | 3.1 g | - |
| Retinol | - | 32 µg | - |
| Salt | - | 0.1 g | - |
| Selenium | - | 1.2 µg | 2% |
| Silica | - | 0.1 mg | - |
| Sodium | - | 47 mg | 2% |
| Sugar | - | 4.7 g | 9% |
| Sulfur | - | 29 mg | - |
| Vitamin A | - | 33 µg | 4% |
| Vitamin ARE | - | 34 µg | - |
| Vitamin B1 (Thiamin) | - | 0.02 mg | - |
| Vitamin B12 (Cobalamin) | - | 0.27 µg | - |
| Vitamin B2 (Riboflavin) | - | 0.19 mg | - |
| Vitamin B3 (Niacin) | - | 0.1 mg | - |
| Vitamin B4 (Choline) | - | 15 mg | - |
| Vitamin B5 (Pantothenic acid) | - | 0.3 mg | - |
| Vitamin B6 (Pyridoxine) | - | 0.02 mg | - |
| Vitamin B7 (Biotin) | - | 2 mg | - |
| Vitamin B9 (Folate) | - | 5.1 µg | - |
| Vitamin C (Ascorbic acid) | - | 0.6 mg | - |
| Vitamin D | - | 0.01 µg | - |
| Vitamin E | - | 0.05 mg | - |
| Vitamin K | - | 160 µg | 213% |
| Water | - | 88.4 g | - |
| Zinc | - | 0.4 mg | 4% |
No nutrients matching your search criteria
Nutritional Profile Comparison
📈 Interactive ChartNutrient content comparison per serving
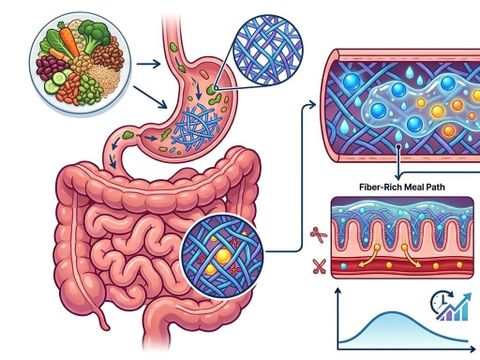
Blood Glucose Curve & Glycemic Index
Biochemical model of blood glucose dynamics (0-180 min) accounting for fat, protein, and fiber buffering.
Blood Glucose Curve (0-180 min)
Biochemical model of blood glucose dynamics (0-180 min) accounting for fat, protein, and fiber buffering.
Glycemic Load (GL) combines both the Glycemic Index (GI) and the actual amount of digestible carbohydrates in a serving.
Clinical thresholds: Low ≤ 10 pts • Moderate 11–19 pts • High ≥ 20 pts